
Co-authored with Lila Rieber.
In The Singularity is Near, Ray Kurzweil writes that “every aspect of information and information technology is growing at an exponential pace.” ((Page 85. In the same book, he also writes that “we see ongoing exponential growth of every aspect of information technology, including price-performance, capacity, and rate of adoption.” (p. 377). In How to Create a Mind, Kurzweil writes that “In the course of my investigation, I made a startling discovery: If a technology is an information technology, the basic measures of price/performance and capacity… follow amazingly precise exponential trajectories” (p. 254).)) In Abundance, the authors list eight fields — including nanomaterials, robotics, and medicine — as “exponentially growing fields.” ((Page 57. In general, Diamandis & Kotler seem to agree with Kurzweil that all information technologies experience exponential growth curves. E.g. on page 99 they write that “Although [some agroecological] practices themselves look decidedly low tech, all the fields they’re informed by are information-based sciences and thus on exponential growth curves,” and on page 190 they write that “almost every component of medicine is now an information technology and therefore on an exponential trajectory.”)) The Second Machine Age says that “technical progress” in general is “improving exponentially.” ((Page 10. The authors also seem to expect exponential trends for anything that becomes a digital process: “…batteries… haven’t improved their performance at an exponential rate because they’re essentially chemical devices, not digital ones…” (p. 52).))
These authors are correct to emphasize that exponential trends in technological development are surprisingly common (Nagy et al. 2013), and that these trends challenge the wisdom of our built-in heuristic to ignore futures that sound absurd. (To someone in the 1980s, the iPhone is absurd. To us, it is an affordable consumer good.)
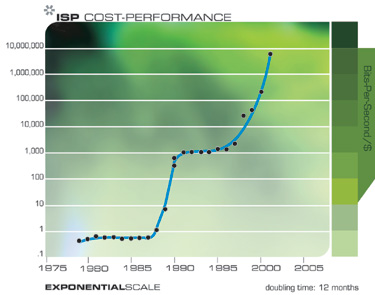
Unfortunately, these and other popular discussions of “exponential technologies” are often very succinct and therefore ambiguous, resulting in public and professional misunderstanding. ((E.g. Kurzweil seems to use a fairly loose definition of “exponential.” For example in Kurzweil (2001) he gives this chart of ISP cost-performance as an example exponential trend. Sometimes this seems to cause confusion in dialogue. For example, in response to Ilkka Tuomi’s criticisms (2002, 2003) of claims of exponential trends in computing, Kurzweil wrote that if Tuomi were correct, “I would have to conclude that the one-quarter MIPS computer costing several million dollars that I used at MIT in 1967 and the 1000 MIPS computer that I purchased recently for $2,000 never really existed… I admire his tenacity in attempting to prove that the world of information technology is flat (i.e., linear).” But Tuomi’s views don’t entail that, and Tuomi didn’t say that trends in information technology have been linear. The conflict appears to stem from the fact that Tuomi was using “exponential” in the strict sense, while Kurzweil was using the term in a very loose sense. This becomes clearer in Tuomi’s reply to Kurzweil.)) I (Luke) regularly encounter people who have read the books above and come away with the impression that all information technologies show roughly exponential trends all the time. But this isn’t true unless you have a very broad concept of what counts as “roughly exponential.”
So, without speculating much about what Kurzweil & company intend to claim, we’ll try to clear up some common misunderstandings about exponential technologies by showing a few examples of exponential and not-so-exponential trends in information technology. A more thorough survey of trends in information technology must be left to other investigators. ((Our thanks to Jonah Sinick for his assistance in researching this post.))
Computations per dollar: still exponential
It’s clear that Kurzweil himself does not literally mean that “every aspect of information and information technology is growing at an exponential pace,” for he has previously discussed examples of non-exponential growth in some aspects of information technology. For example, he’s well aware that the exponential trend in processor clock speed broke down in 2004, as shown in Fuller & Millett (2011a): ((It should be noted, however, that the exponential trend line for clock speed on page 61 of The Singularity is Near (2005) is now known to be incorrect. Kurzweil’s graph used the 2002 ITRS report to project the trend line for 2001-2016, but actual growth in clock speed fell substantially short of the ITRS projection.))
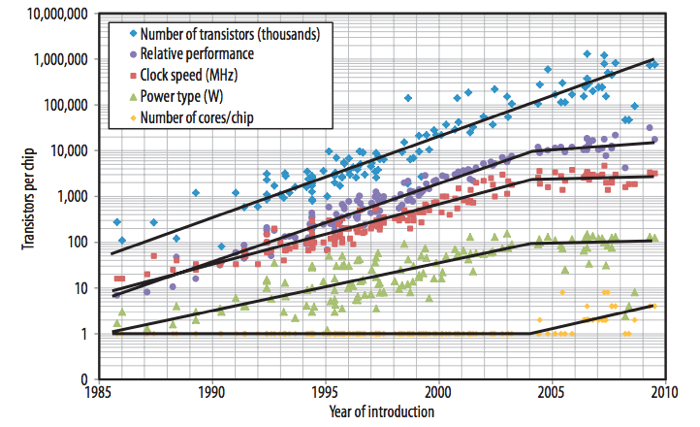
Because this is a logarithmic chart, a straight line represents an exponential trend. Notice that clock speed stopped improving exponentially in 2004, but transistors per chip has continued to increase exponentially via the jump from single-core to multicore processors.
Elsewhere, Kurzweil tends to emphasize exponential trends in price-performance ratios specifically, for example computations per dollar. This is perfectly reasonable. Most of us don’t care about the fine details of processor architecture — we just care about how much stuff we can do per dollar. ((As Fuller & Millett (2011b) write, “When we talk about scaling computing performance, we implicitly mean to increase the computing performance that we can buy for each dollar we spend” (p. 81).)) And thus far, the exponential trend in computations per dollar has kept up. ((Kurzweil (2012), ch. 10, footnote 10 shows “calculations per second per $1,000” growing exponentially from 1900 through 2010, including several data points after 2004. However, we couldn’t find his data sources, and we don’t know whether he adjusted for inflation, so we’ve relied instead on a data set provided by Koh & Magee (2006), extended by data we pulled from NotebookCheck, PCStats, Tom’s Hardware, and CPU-World. Our raw data are here and show a continuing exponential trend in MIPS per dollar, adjusted for inflation.))
It’s unclear, however, how much longer this trend can be maintained. In particular, the dark silicon problem may slow the currently exponential trend in computations per dollar. Joel Hruska covers other recent challenges to the trend here, including the halted production of the 450mm wafers that Intel, TSMC, and Samsung all bet their money on 18 months ago.
DRAM capacity per dollar: a slowing trend
Another important price-performance trend is DRAM capacity per dollar. This trend was almost precisely exponential for many years but recently the trend has slowed: ((This chart uses data from Bryant & O’Hallaron (2011), p. 584 and from the Performance Curve Database. Raw data here.))
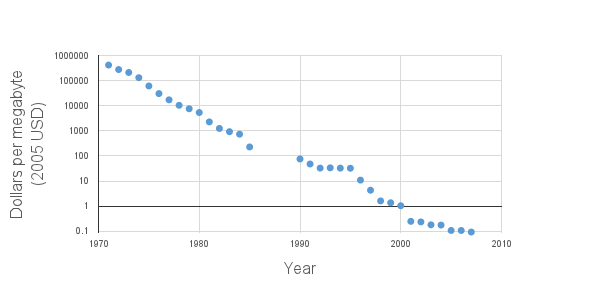
The same slowing trend for DRAM is also reported in Hennessy & Patterson (2011), on page 17. On page 100 they remark:
DRAMs obeyed Moore’s law for 20 years, bringing out a new chip with four times the capacity every three years. Due to the manufacturing challenges of a single-bit DRAM, new chips only double capacity every two years since 1998. In 2006, the pace slowed further, with the four years from 2006 to 2010 seeing only a [single] doubling of capacity.
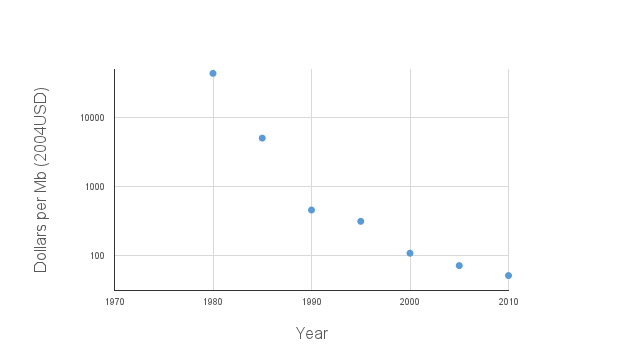
SRAM capacity per dollar: a slowing trend
What about another kind of computer memory, like SRAM? The cost of SRAM dropped precipitously from 1980 to 1990 but has dropped more slowly since then. ((Data from Bryant & O’Hallaron (2011), p. 584. Raw data here.))
Hard drive capacity per dollar: interrupted by floods in Thailand
Cost per gigabyte of hard drive storage had been dropping exponentially for about 30 years when suddenly hard drive prices actually increased for a while because October 2011 floods in Thailand destroyed some hard drive factories. Hard drive prices have been comparatively flat since then: ((Our data are drawn from Matthew Komorowski’s page on storage cost (but adjusted for inflation), Koh & Magee (2006), Bryant & O’Hallaron (2011), and the Performance Curve Database.))
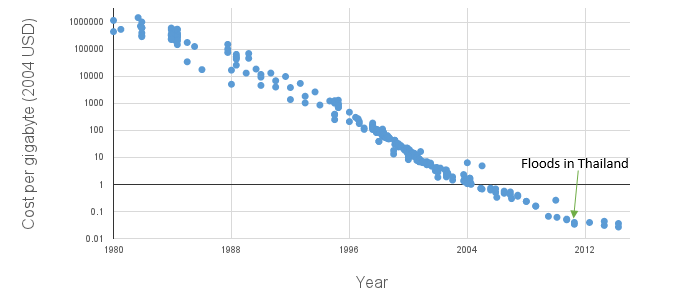
The floods hurt many computing providers, who struggled (and sometimes failed) to offer services at the low prices they had anticipated based on exponential expectations: see e.g. the comments by BackBlaze, Intel, and Joyent.
Whereas the exponential trend for processor clock speed was brought to a halt by physics, the exponential trend in cost per gigabyte of storage was slowed (at least for now) by natural disaster.